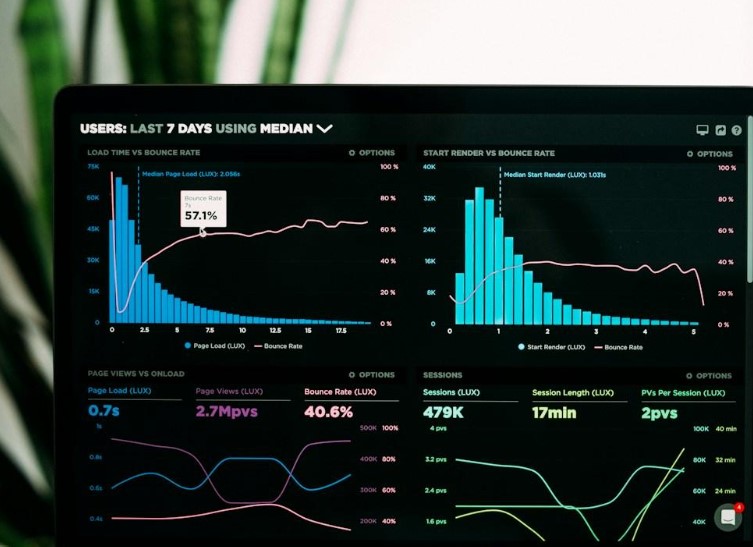
Column charts have significant business applications as they serve as a cornerstone for data-driven decision-making in today’s competitive business landscape. By visually representing data in a clear and easy-to-understand format, column charts help in analyzing large datasets, aiding in forecasts, and facilitating effective communication during presentations. They are commonly used for business performance analysis, market research, financial analysis, and in various other domains to compare, analyze, and interpret data across different categories or groups.
Value of the Business Applications of Column Charts
The value of column charts in business applications lies in their ability to visually represent data through vertical columns, making it easier to compare values across different categories or time periods. Column charts are versatile and commonly used for various purposes in business analytics. They are effective for highlighting values, comparing data sets, and showing trends over time. Additionally, column charts can be utilized to display part-to-whole relationships, making them valuable for visualizing proportions and percentages within a dataset. Overall, the simplicity and clarity of column charts make them a fundamental tool for businesses to analyze and present data effectively.
Data Representation for Interpreting Column Charts
Interpreting column charts involves understanding how data is visually represented in these charts to extract meaningful insights. In a column chart, vertical bars are used to display and compare data across different categories or groups. The height of each column corresponds to the value it represents, making it easy to compare values visually. The x-axis typically lists the categories being compared, while the y-axis denotes the scale or values each category represents. By analyzing the height of the columns, viewers can quickly grasp the data trends, patterns, and disparities within the dataset. Understanding the axis values, data labels, legends, and customization options in column charts is crucial for accurate interpretation and analysis. Overall, column charts are powerful tools for data representation, enabling users to identify trends, track performance metrics, and make informed decisions based on the visual representation of data.
The Advantages of using Column Charts in Business
The advantages of using column charts in business are significant and contribute to effective data visualization and decision-making processes. Column charts offer several benefits, including:
- Clear Data Presentation
Column charts provide a clear and easy-to-understand visual representation of data, making it simpler for stakeholders to interpret complex datasets and identify patterns or trends. - Comparative Analysis
These charts excel at comparing different items or showing changes in data over time, allowing businesses to analyze performance metrics, track progress, and make informed decisions based on data trends. - Data-Driven Decision-Making
By presenting data in a graphical format, column charts promote data-driven decision-making over gut feelings or assumptions, enabling businesses to steer their strategies in the right direction with accurate insights. - Efficient Communication
Column charts facilitate clear and effective communication during presentations by visually summarizing large datasets and aiding in forecasts, enhancing the overall understanding of the information being shared. - Versatility
Column charts are versatile tools that can be used for various purposes in business, such as comparing team performance, analyzing sales fluctuations, or presenting revenue generation from different sources, making them adaptable to different business needs.
Features of the Column Charts in Business
Column charts offer several key features that make them invaluable in business applications for data visualization and analysis. The features of column charts in business include their ability to facilitate comparative analysis, support data-driven decision-making, present data clearly, offer versatility in visualizing different types of business data effectively, and enhance communication during presentations. Here are the key features of column charts in business:
- Comparative Analysis
Column charts excel at comparing different items or showing changes in data over time, allowing businesses to analyze performance metrics, track progress, and make informed decisions based on data trends. - Data-Driven Decision-Making
Column charts serve as a cornerstone for data-driven decision-making by providing a graphical display of data, making it easier for decision-makers to grasp complex concepts, identify patterns, and steer strategies in the right direction. - Clear Data Presentation
These charts present data in a clear and easy-to-understand visual format, enabling stakeholders to interpret complex datasets, identify trends, and make informed decisions based on data insights. - Versatility
Column charts are versatile tools that can be used for various purposes in business, such as comparing team performance, analyzing sales fluctuations, or presenting revenue generation from different sources, making them adaptable to different business needs. - Efficient Communication
By visually summarizing large datasets and aiding in forecasts, column charts facilitate clear and effective communication during presentations, enhancing overall understanding of the information being shared.
